∗ , b , Shuixing Zhang a , b , Changhong Liang a , b , Yuhao Dong a , b , Bin Zhang a , b , Wenbo Chen a , b , Zhouyang Lian a , b , Xiaoning Luo a , b , Long Liang a
A B S T R A C T
Purpose: To evaluate the value of pure molecular diffusion(D), perfusion-related diffusion (D*), perfu-sion fraction (f) and apparent diffusion coefficient (ADC) based on intravoxel incoherent motion (IVIM) theory for differential diagnosis of metastatic lymph nodes (LNs) in head and neck squamous cell carci- noma(HNSCC).
Materials and methods: 29 patients with HNSCC and 20 patients with lymph node hyperplasia (LNH) were enrolled in this retrospective study, underwent magnetic resonance (MR) examination. IVIM Diffusion- weighted imaging (IVIM-DWI) was performed with 13 b values. D, D*, f and ADC values were compared between two groups. The diagnostic value of ADC, D, D* and D·D* value were evaluated by Receiver operating characteristic (ROC) curve. Two radiologists measured D, D*, f and ADC values independently. Results: 33 malignant LNs in HNSCC group and 22 benign LNs in LNH group (minimum diameter, ≥5 mm) were successfully examined, ADC(P < 0.05), D (P < 0.01) and f (P < 0.01) were significantly lower in malig- nant LNs than that in benign LNs, whereas D* was significantly higher (P < 0.01). The area under the ROC curve (AUC) for D·D* was 0.983 and was larger than that for D* (0.952), D (0.78) and ADC (0.67).
Conclusion: Our results indicate that IVIM DWI is feasible in the diagnosis of LN metastasis. D was sig- nificantly decreased in malignant LNs reflected increased nuclear-to-cytoplasmic ratio tissue, and D* was significantly increased reflected increased blood vessel generation and parenchymal perfusion in malignant LNs.
1. Introduction
Squamous cell carcinoma (SCC) accounts for 5% of all malignant tumors over the world [1]. It is the most common malignancy in the head and neck region. A multitude of metastatic LNs is often associated with a poor prognosis [2]. In some cases, the presence of LNs metastasis can be found before a significant clinical sign of primary head and neck tumors was observed. The detection of cervical node metastasis often helps for the preoperative determi- nation of the necessary extent of neck dissection in patients with HNSCC. For differentiating benign LNs from metastatic LNs, node biopsy is definitive, but this method is invasive and dependent on experienced operator. In noninvasive imaging methods, com- puted tomography (CT) and MRI have been used for the detection. However, these image methods can differentiate malignant LNs from benign LNs accounting to the imaging features (the maximum diameter was ≥10 mm, the minimum diameter was ≥6 mm, cen-tral necrosis, indistinct nodal margins) with nonspecific diagnostic value [3].
Diffusion-weighted imaging (DWI) produces contrast due to dif- ferences in water diffusivity in distinct tissues. However, some studies have examined that diffusion estimation can be substan- tially confounded by perfusion based on the incoherent motion of blood in sufficiently random microvascular network at the macro- scopic level. Increased perfusion and vascularisation of metastatic cervical LNs in HNSCC compared to benign LNs have been reported [4–6].
The intravoxel incoherent motion (IVIM) model [7] was devel- oped to permit the simultaneous quantification of the signal stemming from both diffusion component (diffusion coefficient D) and vascular component (perfusion parameter f, D*) noninva- sively. This advanced imaging technique is based on DWI with an increased number of b-values. By analyzing the multiple b- value DWI data, a pronounced signal decay at low b-values can be acquired in well perfused tissue [8]. By applying an inversion recovery DWI sequence with blood suppression, previous studies have confirmed, that this non-monoexponential, pronounced sig- nal decay at low b-values is caused by signal from the vascular component due to a combination of blood flow, blood volume and T2-signa l[9]. By using a biexponential fit on DWI data, the perfu- sion parameter f, D* and the perfusion free diffusion coefficient D can be separated [9,10]. In contrast to the conventional ADC-value affected by cellularity and perfusion effects [8], the three new sur- rogate markers are related to tissue microstructure (D) and to the vascular component (f, D*).
Therefore, application of IVIM analysis may be more advanta- geous and sensitive than conventional DWI in the evaluation of LNs metastasis of HNSCC. The purpose of our study was to charac- terize the perfusion parameter f, D* and the diffusion coefficient D in metastatic LNs of HNSCC.
2. Materials and methods
2.1. Ethics statement
The study was approved by the local ethics committee
2.2. Patients
From September 2013 to December 2014, 49 consecutive patients were enrolled in this retrospective study. All the patients underwent IVIM-DWI. subsequent surgery or biopsy were per- formed within 2 weeks. The subjects were divided into 2 groups, group A comprised 29 patients with diagnosed HNSCC and group B comprised 20 patients with LNH. Among the A group, 20 were men and 9 were women; their age ranged from 19 to 68 years, with a mean age of 48 years. The primary cancers were of the lar- ynx (n = 6), tongue (n = 2), nasopharynx (n = 13), nasal cavity (n = 4), oropharynx (n = 4). Among the LNH group, 12 were men and 8 were women; their age ranged from 16 to 56 years, with a mean age of 41 years. LNs with a short axis of at least 5 mm [3] were included in this study. All patients of HNSCC group underwent IVIM before hemoradiotherapy.
2.3. MRI protocol
MR imaging examinations of the LNs of HNSCC were performed using a 3.0-T whole-body system (Signa Excite HD, GE Healthcare, Milwaukee, WI) with a 40-mT/m maximum gradient capability and a standard receive-only head and neck coil. The imaging proto- col included axial T1-weighted spin-echo images (repetition time (TR)/echo time (TE) 600/23 ms, 4 mm section thickness with a 1- mm intersection gap and number of excitations (NEX) equal to 2), and axial T2-weighted turbo spin-echo images with fat sup- pression (TR/TE 5200/137 ms; 4 mm section thickness, with 1 mm intersection gap and NEX = 2) using a 512 × 288 imaging matrix.
2.4. IVIM DW imaging sequence
The IVIM DW imaging sequence was performed after conven- tional MR sequence. Thirteen b values (0, 10, 20, 30, 50, 80, 100, 150, 200, 300, 400, 600 and 800 s/mm 2 ) were applied with a single-shot diffusion-weighted spin-echo echo-planar sequence. The lookup table of gradient directions was modified to allow multiple b value measurements in one series. Parallel imaging was used with an acceleration factor of 2. A local shim box covering the HNSCC scanning area was applied to minimize susceptibility artefacts. In total, 20 axial slices covering the HNSCC scanning area for patients respectively were obtained with a 24-cm field of view, 4 mm slice thickness, 1 mm slice gap, 3000 ms TR, 58 ms TE, 128 × 128 matrix and NEX = 2. The nominal scan time was 3 min 45s
2.5. IVIM DW MRI analysis
2.5.1. ADC value
The ADC value was calculated by fitting diffusion weighted images at b = 0 and four non-zero b values(200, 400, 500 and 600s/mm2) into Eq. (1).
Sb/S0 = exp(-bADC) (1)
2.5.2. D, D* and f value
According to IVIM, the signal intensities and b values are related as follows:
S b /S 0 = (1−f )exp(−bD) + fexp(−bD ∗ ) (2)
Where S 0 = signal intensity at the b value of 0; S b = signal intensity at the b value denoted by the subscript; D = true diffusion coeffi- cient of a water molecule; D* = pseudo-diffusion coefficient due to microcirculation; and f = microvascular volume fraction, indicating the fraction of diffusion related to microcirculation. Because D* is roughly one order of magnitude greater than D[8], −b D* would be less than−3 at a high b value (>200 s/mm 2 ), and the term fexp(−b D*) would be less than 0.05f and can therefore be neglected. In this case, Eq. (2) can be simplified as follows:
S b /S 0 = (1−f )exp(−bD) (3)
Hence, for high b values (300, 400, 600 and 800 s/mm 2 ) S b was first fitted to Eq. (3) using a linear model, and the true diffusion coefficient D was calculated. Although we had previously calculated the f value, its accuracy was not acceptable; f was recalculated using Eq. (2). Then, we fitted S b for all b values using Eq. (2) with a fixed D value using the nonlinear Levenberg–Marquardt method. When fitting Eq. (2), the initial estimated values for f and D* were set as the previously calculated f value from Eq. (3) and 10 × 10 −3 mm 2 /s, respectively. Subsequently, the f and D* were obtained.
2.6. ROI
For these quantitative analyses, a region of interest (ROI) anal- ysis was performed. Two experienced radiologist first identified the corresponding area on the diffusion weighted images by com- paring these data with morphological images. Then ROIs were drawn on diffusion weighted images including the whole volume of the LNs while excluding large necrotic areas and adjacent cervi- cal vessels. One patient was excluded from analyses because of a macroscopically completely necrotic lymph node metastasis. The signal intensities within each ROI were averaged first and subse- quently the IVIM-parameter D, D* and f were calculated.
2.7. Statistical analysis
Mean values of all IVIM parameters were measured inde- pendently by two experienced radiologists in our department. A nonparametric Mann–Whitney test was used to compare IVIM parameters between malignant and benign lymph nodes. The D, D*, and ADC were assessed using a Receiver operating character- istic (ROC) curve to estimate the diagnostic tolerance. According to previous study [11], we treated D and D* values as covariate respectively and the benign or malignancy as dependent variable to calculate the prediction probability through logistic regression

3. Results
IVIM DWI was successful in 46 of 49 patients, 33 malignant LNs from A group and 22 benign LNs from B group were successfully examined. All the LNs were confirmed histologically by surgery or biopsy. IVIM DWI was unsuccessful in the remaining 3 patients with HNSCC because of susceptibility artefacts around the skull base and paranasal sinuses (2 NPC cases) or motion artefacts due to swallowing (1 laryngeal carcinoma case).
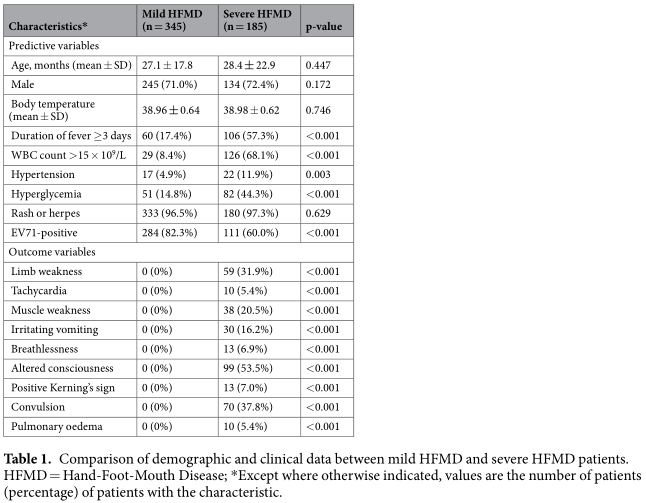
Values of the IVIM parameters for cases of malignant and benign LNs are presented in Table 1. Our data demonstrated that ADC(P = 0.035), D (P < 0.0001) and f (P < 0.0001) were significantly lower in the malignant LNs than in the benign nodes, whereas D* was significantly higher (P < 0.0001) in the malignant LNs.
Box plots comparing D, D*and f between malignant and benign LNs are shown in Fig. 1. As shown in Fig. 2, the ROC anal- ysis indicated that when both sensitivity and specificity were adjusted to produce the highest accuracy, the optimal D and ADC thresholds for distinguishing malignant LNs from benign LNs were 0.726 × 10 −3 mm 2 /s and 1.14 × 10 −3 mm 2 /s respectively. The D* value cut-off point was determined to be 83 × 10 −3 mm 2 /s for malignant LNs. Fig. 2 shows that the AUC for D·D* (0.983) was larger than D* (0.952), D (0.78) and ADC (0.67).


IVIM DW images of benign LNs (Fig. 3) and malignant LNs (Fig. 4), which were performed with 13 b values (in the range 0–800s/mm 2 ) are shown. The diffusion-weighted signal decayed in a bi-exponential manner within the range of low b val- ues (0–200 s/mm 2 ). In addition, the slope of the signal fitting curve (Fig. 3c) in the malignant LNs was larger than that in the benign LNs(Fig. 4c), especially within the range of low b values (0–200 s/mm 2 ). This result may demonstrate that the DWI signal was higher in the malignant LNs; thus, the value of D was lower in the malignant LNs than in the benign nodes.


4. Discussion
King [12] and Jin Zhong [13] have investigated diffusion prop- erties of metastatic LNs using conventional ADC model. This model assumes that diffusion-weighted signals should decay mono- exponentially with b value. However, the blood flow in the capillary network contributes to the diffusion-weighted signal and decreases in a bi-exponential fashion at lower b values (<200 s/mm 2 ). Because the IVIM model fits the signal decay with a bi-exponential decay, the IVIM parameters (D, f, and D*) may reflect water diffusion and blood perfusion more accurately [7]. f and D* are related to blood perfusion, and D is related to water diffusion. The IVIM model has been used to investigate breast cancer [14], hepatocellular carcinoma [15], pancreas [16], hepatic fibrosis [17]. IVIM tech- nique has also been used to investigate HNSCC in Previous studies [18,19], some previous studies applied IVIM technique in the NPC [20,21]. However, few of studies have performed IVIM DW MRI of metastatic lymph nodes in head and neck region, Lu, Y [22] stated the differences between primary head and neck tumors and nodal metastasis using IVIM model. Hauser, T [23] evaluated the potential predictive value of IVIM parameters considering therapy response of lymph node metastasis.
IVIM model depends on the underlying tissue architecture. For example, a recent study demonstrated that bi-exponential mod- els for IVIM may be used to model the DW-MRI signal decay of tumor tissues, suggesting that most tumor tissue voxels exhibit both perfusion and diffusion and that diffusion in tumor tissues is either free or restricted [24]. Furthermore, the ADC models are too simple to account for the complex incoherent motions in tumors because they do not consider blood perfusion in tumor tissues. Therefore, Guiu recently suggested that the ADC model should be abandoned [25] because it fits a bi-exponential decay with a mono-exponential equation, which is mathematically unaccept- able except in cases when the b values used are less affected by the perfusion process (i.e. >200 s/mm 2 ). In such cases, the result of the ADC model simply corresponds to the calculation of D, which is the true water diffusion coefficient, reflecting both intra- and extracellular molecular diffusion. In our study, the diffusion- weighted signals at four b values (300, 400, 600 and 800 s/mm 2 ) were fitted using a mono-exponential equation to calculate D, which, together with local shim, a short TE, parallel imaging and improved SNR at 3.0 T, may have allowed the calculation of a more reliable value for D. We found that D was significantly lower in cases of malignant lymph node than in case of benign lymph node (mean, 0.57 ± 0.12 × 10 −3 mm 2 /s vs 0.74 ± 0.21 × 10 −3 mm 2 /s, respectively; P < 0.001), indicating that D was restricted in malig- nant lymph nodes. Simultaneously, the ROC curve (Fig. 2) suggest that IVIM DWI has clinical potential to distinguish two LNs on the basis of their D values with a threshold of 0.726 × 10 −3 mm 2 /s. The significant differences in D values between two groups investi- gated in the present study may be due to hypercellular tissue in malignant nodes, an increased nuclear-to-cytoplasmic ratio and stromal tissues would reduce water diffusivity [26], and appear to exhibit higher D values. That result is in satisfactory agreement with previous studies [13]. In addition, because IVIM DWI exclude the influence of perfusion in D estimation, our D values were mildly lower than the ADC values estimated in conventional DWI reported by Jin Zhong [13]. Our D estimation indicates the restricted diffusion in malignant LNs, therefore, D value could improve the accuracy in the distinction between benign and malignant nodes. Fig. 2 demonstrated that the AUC for D (0.78) was larger than ADC (0.67). Therefore, D value will be more accurate than ADC in differential diagnosis.
The D* value is associated with perfusion in IVIM theory (Eq. (2)), and perfusion levels may depend on LNs microvessel attenu- ation. Furthermore, the D* value is determined according to the signal intensity ratios of the blood capillaries. In our study, D* was more than 10 times greater than D, which explains why D* has a stronger influence on signal decay when b is less than 200 s/mm 2 . In addition, the accuracy of D* estimations improves with increased sampling in the 0–200 s/mm 2 range [27]. Yong- gang Lu [22] Using an 17-b DW imaging sequence reported that 11 b values (0, 13, 17, 23, 30, 40, 53, 70, 92, 122 and 161 s/mm 2 ) could be used to model the first portion of the bi-exponential decay curve, encompassing both D and D*. In our study, a 13-b DW imaging sequence was used, and 9 of these b values (0, 10, 20, 30, 50, 80, 100, 150, 200s/mm 2 ) were applied to model this region of the bi-exponential curve. The results showed a mean D* value for metastatic LNs that was in agreement with that on NPC tumor of a previous study (152.96 ± 27.41 × 10 −3 mm 2 /s) [20] and on metastatic nodes by Lu (ranging from 76.18 to 180.39 × 10 −3 mm 2 /s) [24]. However, Lu [22] on metastatic nodes showed a lower D*(50.47 ± 26.98 × 10 −3 mm 2 /s) lower than our results, and lower than their previous study [24]. This dis- crepancy found may be attributed to different pathological types of tumor and different characteristics of the patient population. Furthermore, we found a significant increase in D* for metastatic nodes (mean, 120.89 ± 26.94 × 10 −3 mm 2 /s vs 68.78 ± 17.72 × 10 −3 mm 2 /s; P < 0.0001), thereby confirming that D* is sensitive to differences in metastatic nodes perfusion. This increase may result from differences in the histologic structure of malignant metastatic nodes, which has abundant vessels. In the current study, Fig. 2 demonstrated that the AUC for D•D* (0.983) was larger than D* (0.952), D (0.78) and ADC (0.67). this result sug- gest that a combination of D and D* may be a more useful biomarker than ADC for the diagnosis and differentiation of metastatic lymph nodes in high-risk populations.
In IVIM theory, the f value may represent the level of blood perfusion. In our study, the mean value of f for malignant LNs was 0.20 ± 0.02, this result was similar to recent studies, a pre- vious study reported the mean value of f for the NPC was 16.44 ± 2.01%[20]. However, the metastatic LNs showed a lower f estimation than that with benign LNs, although malignant LNs have been associated with increased capillary perfusion. This result is similar to those in previous study, we found that f was signif- icantly decreased in primary NPC, lower than that with enlarged adenoids [20]. We have explained that f is dependent on TE, espe- cially for tissues with considerably shorter transversal relaxation times than blood. f value appear positive correlation with perfu-sion [28] in loose tissues (with a long T2, such as breast), and is relatively accurate. In the more dense tissues (with a short T2, such as squamous cell carcinoma), f value is not stable [20], T2 attenuation would be more obvious with a longer TE, the signal decays further at low b values, which means that the f value will increase. This effect would likely be significant for IVIM imaging of organs with short T2 times. However, in the IVIM approach, relax- ation effects are neglected, which may be appropriate when the relaxation time of the tissue of interest is similar to that of blood. However, when these relaxation times diverge, e.g. in cases of metastatic and benign LNs, the extracted perfusion-related param- eters may depend on measurement parameters such as TE and TR. Indeed, different tissues demonstrated completely different T2 times [29], e.g. cases of metastatic and benign LNs . In the cur- rent study, this TE-dependence effect was also significant, which may result from that malignant LNs demonstrated the shorten T2 times. Consequently, IVIM theory neglect the effects of TE, so it is applicable to tissues with long T2 time.
The current study had certain limitations. As an example, few cases of HNSCC nodes were included in the series, and we did not evaluate the difference between different pathological types of HNSCC metastatic LNs. Secondly, motion artefacts increase with the use of higher b values, typically approximately 1,000s/mm 2 , that would cause diffusion related signal decay. We tried to minimize this effect by setting the maximum b value to 800s/mm 2 . Addition- ally, TSE-based diffusion weighted image, or readout segmented EPI (RESOLVE sequence) will be applied in the future research to reduce susceptibility artefacts
In conclusion, D was significantly reduced in malignant metas- tasis lymph nodes compared with benign nodes, reflects the restriction of water diffusion due to hypercellular tissue. D* was significantly increased, because of the increased blood vessel gen- eration and parenchymal perfusion in patients with HNSCC. These results demonstrate that bi-exponential models of IVIM maybe the preferred technique for the differentiation and preoperative assess- ment of LNs in HNSCC.
Conflict of interest
the authors do not have any possible conflicts of interest.
Acknowledgments
The scientific guarantor of this publication is Shuixing Zhang. The authors of this manuscript declare relationships with the fol- lowing companies: funding from the National Scientific Foundation of China (grant 81171329, 81571664) and from the Science and Technology Planning Project of Guangdong Province, China (grant 2014A020212244)
References
[1] S. Nakamatsu, E. Matsusue, H. Miyoshi, S. Kakite, T. Kaminou, T. Ogawa, Correlation of apparent diffusion coefficients measured by diffusion-weighted MR imaging and standardized uptake values from FDG PET/CT in metastatic neck lymph nodes of head and neck squamous cell carcinomas, Clin. Imaging 36 (2012) 90–97.
[2] J.A. Langendijk, B.J. Slotman, I. van der Waal, P. Doornaert, J. Berkof, C.R. Leemans, Risk-group definition by recursive partitioning analysis of patients with squamous cell head and neck carcinoma treated with surgery and postoperative radiotherapy, Cancer 104 (2005) 1408–1417.
[3] H. Kato, M. Kanematsu, H. Watanabe, K. Mizuta, M. Aoki, Metastatic retropharyngeal lymph nodes: comparison of CT and MR imaging for diagnostic accuracy, Eur. J. Radiol. 83 (2014) 1157–1162.
[4] A.A. Razek, L.G. Elsorogy, N.Y. Soliman, N. Nada, Dynamic susceptibility contrast perfusion MR imaging in distinguishing malignant from benign head and neck tumors: a pilot study, Eur. J. Radiol. 77 (2011) 73–79.
[5] S. Bisdas, M. Baghi, A. Smolarz, N.C. Pihno, T. Lehnert, R. Knecht, et al., Quantitative measurements of perfusion and permeability of oropharyngeal and oral cavity cancer, recurrent disease, and associated lymph nodes using first-pass contrast-enhanced computed tomography studies, Invest. Radiol. 42 (2007) 172–179.
[6] A. Trojanowska, P. Trojanowski, S. Bisdas, G. Staskiewicz, A. Drop, J. Klatka, et al., Squamous cell cancer of hypopharynx and larynx − evaluation of metastatic nodal disease based on computed tomography perfusion studies, Eur. J. Radiol. 81 (2012) 1034–1039.
[7] D. Le Bihan, E. Breton, D. Lallemand, M.L. Aubin, J. Vignaud, M. Laval-Jeantet, Separation of diffusion and perfusion in intravoxel incoherent motion MR imaging, Radiology 168 (1988) 497–505.
[8] D. Le Bihan, Intravoxel incoherent motion perfusion MR imaging: a wake-up call, Radiology 249 (2008) 748–752.
[9] A. Lemke, F.B. Laun, D. Simon, B. Stieltjes, L.R. Schad, An in vivo verification of the intravoxel incoherent motion effect in diffusion-weighted imaging of the abdomen, Magn. Reson. Med. 64 (2010) 1580–1585.
[10] A. Lemke, F.B. Laun, M. Klauss, T.J. Re, D. Simon, S. Delorme, et al., Differentiation of pancreas carcinoma from healthy pancreatic tissue using multiple b-values: comparison of apparent diffusion coefficient and intravoxel incoherent motion derived parameters, Invest. Radiol. 44 (2009) 769–775.
[11] S.R. Chung, S.S. Lee, N. Kim, E.S. Yu, E. Kim, B. Kuhn, et al., Intravoxel incoherent motion MRI for liver fibrosis assessment: a pilot study, Acta Radiol. 56 (2015) 1428–1436.
[12] A.D. King, A.T. Ahuja, D.K. Yeung, D.K. Fong, Y.Y. Lee, K.I. Lei, et al., Malignant cervical lymphadenopathy: diagnostic accuracy of diffusion-weighted MR imaging, Radiology 245 (2007) 806–813.
[13] J. Zhong, Z. Lu, L. Xu, L. Dong, H. Qiao, R. Hua, et al., The diagnostic value of cervical lymph node metastasis in head and neck squamous carcinoma by using diffusion-weighted magnetic resonance imaging and computed tomography perfusion, BioMed Res. Int. 2014 (2014) 260859.
[14] S. Suo, N. Lin, H. Wang, L. Zhang, R. Wang, S. Zhang, et al., Intravoxel incoherent motion diffusion-weighted MR imaging of breast cancer at 3.0 tesla: comparison of different curve-fitting methods, J. Magn. Reson. Imaging: JMRI 42 (2015) 362–370.
[15] S. Kakite, H. Dyvorne, C. Besa, N. Cooper, M. Facciuto, C. Donnerhack, et al., Hepatocellular carcinoma: short-term reproducibility of apparent diffusion coefficient and intravoxel incoherent motion parameters at 3.0T, J. Magn. Reson. Imaging: JMRI 41 (2015) 149–156.
[16] C. Ma, L. Liu, Y.J. Li, L.G. Chen, C.S. Pan, Y. Zhang, et al., Intravoxel incoherent motion MRI of the healthy pancreas: monoexponential and biexponential apparent diffusion parameters of the normal head, body and tail, J. Magn. Reson. Imaging: JMRI 41 (2015) 1236–1241.
[17] S. Ichikawa, U. Motosugi, H. Morisaka, K. Sano, T. Ichikawa, N. Enomoto, et al., MRI-based staging of hepatic fibrosis: comparison of intravoxel incoherent motion diffusion-weighted imaging with magnetic resonance elastography, J. Magn. Reson. Imaging: JMRI 42 (2015) 204–210.
[18] S. Marzi, F. Piludu, A. Vidiri, Assessment of diffusion parameters by intravoxel incoherent motion MRI in head and neck squamous cell carcinoma, NMR Biomed. 26 (2013) 1806–1814.
[19] M. Sumi, T. Nakamura, Head and neck tumours: combined MRI assessment based on IVIM and TIC analyses for the differentiation of tumors of different histological types, Eur. Radiol. 24 (2014) 223–231.
[20] S.X. Zhang, Q.J. Jia, Z.P. Zhang, C.H. Liang, W.B. Chen, Q.H. Qiu, et al., Intravoxel incoherent motion MRI: emerging applications for nasopharyngeal carcinoma at the primary site, Eur. Radiol. 24 (2014) 1998–2004.
[21] Q.J. Jia, S.X. Zhang, W.B. Chen, L. Liang, Z.G. Zhou, Q.H. Qiu, et al., Initial experience of correlating parameters of intravoxel incoherent motion and dynamic contrast-enhanced magnetic resonance imaging at 3.0 T in nasopharyngeal carcinoma, Eur. Radiol. (2016) 2014.
[22] Y. Lu, J.F. Jansen, H.E. Stambuk, G. Gupta, N. Lee, M. Gonen, et al., Comparing primary tumors and metastatic nodes in head and neck cancer usingintravoxel incoherent motion imaging: a preliminary experience, J. Comput. Assist. Tomogr. 37 (2013) 346–352.
[23] T. Hauser, M. Essig, A. Jensen, F.B. Laun, M. Munter, K.H. Maier-Hein, et al., Prediction of treatment response in head and neck carcinomas using IVIM-DWI: evaluation of lymph node metastasis, Eur. J. Radiol. 83 (2014) 783–787.
[24] Y. Lu, J.F. Jansen, Y. Mazaheri, H.E. Stambuk, J.A. Koutcher, A. Shukla-Dave, Extension of the intravoxel incoherent motion model to non-gaussian diffusion in head and neck cancer, J. Magn. Reson. Imaging: JMRI 36 (2012) 1088–1096.
[25] B. Guiu, J.P. Cercueil, Liver diffusion-weighted MR imaging: the tower of Babel, Eur. Radiol. 21 (2011) 463–467.
[26] M.L. White, Y. Zhang, R.A. Robinson, Evaluating tumors and tumorlike lesions of the nasal cavity, the paranasal sinuses, and the adjacent skull base with diffusion-weighted MRI, J. Comput. Assist. Tomogr. 30 (2006) 490–495.
[27] A.D. King, A.C. Vlantis, R.K. Tsang, T.M. Gary, A.K. Au, C.Y. Chan, et al., Magnetic resonance imaging for the detection of nasopharyngeal carcinoma, AJNR Am. J. Neuroradiol. 27 (2006) 1288–1291.
[28] C. Liu, C. Liang, Z. Liu, S. Zhang, B. Huang, Intravoxel incoherent motion (IVIM) in evaluation of breast lesions: comparison with conventional DWI, Eur. J. Radiol. 82 (2013) e782–9.
[29] B. Guiu, J.M. Petit, V. Capitan, S. Aho, D. Masson, P.H. Lefevre, et al., Intravoxel incoherent motion diffusion-weighted imaging in nonalcoholic fatty liver disease: a 3.0-T MR study, Radiology 265 (2012) 96–103.